
The London Green Directory
Air Quality | Waste | Food | Water | Energy | Transportation | Ecowise Consuming | Empowerment | Biodiversity | Circular Economy
Transportation
In our busy, largely suburban city, the automobile has become the primary means of transportation. To improve our local air quality and contribute towards a sustainable climate, we need to reduce our dependence on cars.
National Transportation Data and Trends
Stats Canada tells us:
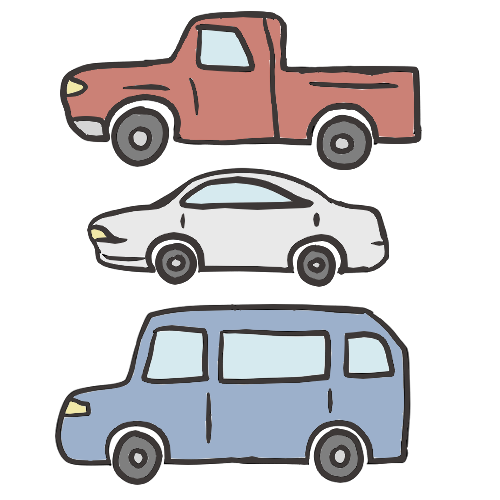
On average, 26.8 million road motor vehicles were registered in Canada in 2024. Of these, 91.6% were passenger cars and light vehicles such as pickup trucks and minivans. The remainder consists of motorcycles, mopeds, and truck tractors and trucks. In addition, 7.5 million trailers and 2.2 million off-road, construction and farm vehicles were registered. From 2023 to 2024 Ontario vehicle registrations increased by 4.2%. Ontario has the highest number of vehicles registered, contributing 9.5 million to the total.
According to Stats Canada, in 2025, approximately 80.9% of Canadian commuters primarily rely on private road vehicles, such as passenger cars, SUVs, pickup trucks and minivans to travel to work. Light vehicles, which weigh less than 4.5 tonnes include all cars, sport-utility vehicles, minivans and pickup trucks. While 2.8 million kilometers were driven through sustainable transportation, meaning public transit and active transportation.
NRCan says:
In fact, if Canadian motorists avoided idling for just three minutes every day of the year, CO2 emissions could be reduced by 1.4 million tonnes annually. This would be equal to saving 630 million litres of fuel and equivalent to taking 320,000 cars off of the road for the entire year. Eliminating unnecessary idling is one easy action that Canadians can take to reduce their GHG emissions that are contributing to climate change.
Vehicle fuel efficiency has greatly improved over the last few years, nowadays fuel efficiency depends on the type of motor and driving style. The fuel consumed per 100km now has a range from 8.2L in 2026 compared to the average of 13 L in 2004. Diesel has become more popular and it is simpler to refine than gasoline. Diesel has 14% more energy than gasoline contributing to the fuel efficiency, these cars can go around 20% farther than the equivalent gas car. However, recent studies have shown the higher energy density contributes to 15% more greenhouse gas emission than a gas powered engine. Hybrid cars are said to have fuel efficiency of 4-5 L/100km and rely on a combination of battery powered and fuel powered motor. Finally, electric cars are the most energy efficient. These cars convert about 59-62% of electrical energy to power the wheels; compare this to the 17-21% energy conversion gas powered cars have.
Local Trends
2026 estimates from StatsCan sow 296,700 adults (London Census Metropolitan Area) are in the labour force. Of these workers, about 80% are commuters and have a commute that lasts, on average, 21.3 minutes. 9.6% are carshare passengers, 6.4% are transit passengers, 5.5% walked or biked to work, and 2.2% used other transportation, such as scooters and motorcycles.
What are the trends nationally involving our dependency on vehicles?
NRCan and statscan states:
- On average, there are 1.47 vehicles per household
- There is more transit use in bigger centres, but driving is still the dominant form of commuting. Time seems to be a factor: almost two-thirds of transit users spent 30 minutes or more to get to work while only a quarter of drivers took that long
- About 84% of households had at least one vehicle

What are the true costs of having a vehicle?
The financial costs of running, maintaining and repairing a vehicle are not the only ones to consider. Traffic injuries and fatalities involving other vehicles, lost wages, health care costs, accidents with cyclists are just a few. On a less personal scale, costs for policing, highway construction, road safety, subsidies to auto and oil industries must be covered; the loss of farmland, plant damage from ground level ozone, traffic congestion, quality of life issues, and disturbing natural habitats. There are also industrial costs- for energy and materials needed to manufacture a vehicle and associated costs of parking lots and disposal of tires and vehicles are all major expenses in supporting vehicle use. Of more recent interest is the suburbanization of the workplace, in turn, placing stresses on urban infrastructure, increasing travel time with significant increases in traffic through downtown areas as well as increased demand from public transit systems.
Air quality impacts – 1L of gasoline produces 2.3kg of carbon dioxide.Other products in the air as a result of burning fossil fuels include sulphur dioxide, hydrocarbons, road surface, tire and brake abrasion substances as well as oil, cadmium, chrome, lead, copper and zinc. Particulate is relatively insensitive to temperature. The US EPA has found winter and summer emissions factors to be the same, therefore, particulate becomes a health issue year round.

Fossil fuel impacts – Oil consumption is massive along with an infrastructure for the distribution and consumption of oil that is not readily adaptable to other energy sources needed given expected peak declines in oil and natural gas production already evident. Focus on natural gas has increased in recent years.
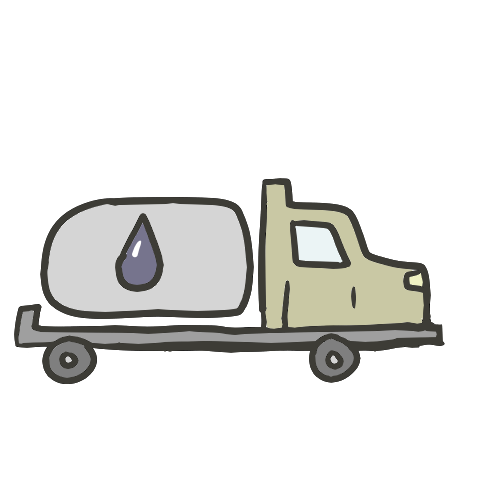
fCanada is the 5th largest crude oil producer in the world. In May 2026, 4.68mb/d of crude oil was produced, 4.4mb/d of oil was exported.
In 2026, some uncertainty is expected given the United States’ decision not to extend the agreement in its current form. The North American Free Trade Agreement (NAFTA) was a three-country accord negotiated by the governments of Canada, Mexico, and the United States that entered into force in January 1994. The intent was to strengthen rules and procedures governing trade and investment to allow more trade. It also prohibited Canada from implementing any restriction on the percentage shipped to the U.S. so that we competed with U.S. users on the open market for “our” own energy. On July 1, 2020, after renegotiations, a new Canada-United States-Mexico Agreement (CUSMA) agreement was established as a long-lasting trading relationship to incorporate new and updated provisions to address 21st-century trade issues.
Federal

Transport Canada, Infrastructure Canada, the Canadian Transportation Agency, the Transportation Appeal Tribunal of Canada, and 16 Crown Corporations are part of a larger Transport, Infrastructure and Communities (TIC) portfolio. Together, they contribute to rural and urban infrastructure, and make sure that our roads, bridges, railroads, ports and airports are well-placed, well-built, well-kept, safe and secure. Their work supports the economy, the environment and the health of Canada’s communities.
Transport Canada (TC) develops and implements programs and policies to protect the natural environment and to achieve a more sustainable transportation system in Canada. Like other federal departments, it is required to prepare a sustainable development strategy every three years. The most recent strategy, 2026-2027, prioritizes enhancing and delivering transportation safety and security oversight, supporting more efficient and reliable supply chains, improving passenger experience by enhancing accessibility, and supporting a cleaner transportation sector by helping businesses use low-carbon and net-zero technologies.
Transport Canada Study and Guides
Transport Canada Corporate Info
Canada’s Ocean Protection Plan safeguards coastlines, improves marine safety and protects marine ecosystems.
A 2007 TC study, ‘The Cost of Urban Congestion in Canada’ was the first systematic analysis of the cost of urban traffic congestion for Canada’s nine largest urban areas. With London being the 11th largest urban centre, this study obviously influenced any existing congestion occurring daily, because the demand exceeds the capacity to move people. More recent updates to the study reve
NRCan’s Office of Energy Efficiency provides extensive information to consumers to purchase new vehicles and on personal vehicle usage including: fuel efficient driving techniques, annual EnerGuide awards for the most fuel-efficient vehicles for current model year and an EnerGuide label for Vehicles on new vehicles since January 1999 with city and highway fuel consumption ratings and estimated annual vehicle fuel costs. If a vehicle has no label, download a PDF version, ask the dealer for a copy or to show you the fuel consumption ratings for a vehicle in the Fuel Consumption Guide, or ask for the manufacturer’s approved fuel consumption rating for the vehicle.
Updated Statistics on Transportation:
Urban Public Transits Stats 2026 – Canada-Wide
May – 127.3 million passenger trips, down 0.4% from April, and 4.8% lower than May 2025.
Operating revenue (excluding subsidies): 335.7 million
Update on Recent Canada’s Transportation and Fuel Usage Statistics
In recent years, Canada’s transportation sector has remained one of the largest consumers of energy, accounting for roughly 2,500 petajoules (PJ) in 2024. Road transportation—primarily through retail fuel sales—made up the bulk of this demand, with 1,521 PJ coming from retail pump sales alone. Gasoline and diesel remain dominant fuels, with gasoline retail use at 1,246 PJ and diesel at 271 PJ, in addition to 360 PJ used by commercial fleets. Meanwhile, jet fuel consumption reached 252 PJ, and electricity use in public transit was modest at 4 PJ. Despite growing fuel demand, transportation-related greenhouse gas emissions rose to 166 megatonnes (Mt CO₂) in 2023, reinforcing the sector’s substantial impact on climate.
Fuel production in Canada increased 9.0% year over year to 25.8 million cubic metres in May 2026. This was the highest production volume for the month of May since 2016. The increase in May happened due to constraints in the supply of crude oil from the Middle East, while global demand and prices of crude oil remained high. Efforts to diversify fuel sources are underway: biofuels made up 10% of transport fuels in 2026, with projections indicating a rise to 15% by 2030. Despite this progress, emissions and fossil fuel dependence remain high, highlighting the challenge of transitioning toward cleaner alternatives.
Electrification is gaining momentum, with electric vehicles (EVs) and hybrids now representing 5.2% of the national vehicle fleet. Following strong momentum through late 2024, new zero-emission vehicles experienced a cooldown in 2025, accounting of all new light-duty registrations. Canada had over 26.8 million registered vehicles in 2026, with 91.6% being light-duty. Public transit also continued its recovery post-pandemic, reaching 1.6 billion rides in 2024, or 84% of pre-COVID levels. At the same time, trucking remains vital for freight, with driver wages averaging $27.10/hour and a notable 36% drop in job vacancies in 2024. As the country moves forward, these shifts in fuel use, electrification, and modal patterns will play a central role in shaping Canada’s low-carbon transportation future.
Provincial
The Ministry of Transportation, through promoting, managing and maintaining Ontario’s multi-modal transportation system, supports the delivery of key Ontario government priorities of building a strong economy including job growth and economic competitiveness and stronger, safer communities.
The Ontario’s Ministry of Transportation’s vision includes 5 key priorities:

- Increasing transit ridership
- Promoting a multimodal transportation network to support the efficient movement of people and goods
- Promoting road safety in order to remain among the safest jurisdictions in North America through education, legislation and regulation and making personal travel safe
- Improving border, highway, bridge infrastructure
- Integrating sustainability by improving mobility, choice and safety
The Ministry of Transportation is committed to supporting Ontario’s Climate Change Action Plan. The MTO’s “Sustainability inSight” is a guide to achieve sustainability with 7 goals for more sustainable transportation:
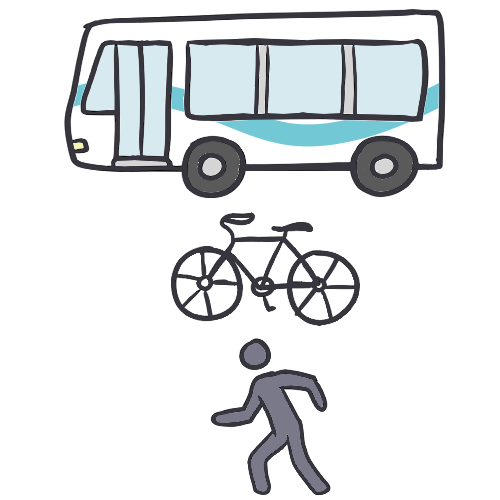
- Increase accessibility by improving mobility, choice and safety
- Integrate transportation and land-use planning to reflect sustainability
- Apply a context-sensitive approach in MTO’s work (this means apply the areas’ needs when making transportation-related decisions)
- Optimize infrastructure design, capacity and investment
- Demonstrate good stewardship (by considering the human, financial and environmental impact in their decisions)
- Engage MTO staff expertise to promote innovation
- Drive a cultural shift towards sustainability
The Ministry frequently proposes additional funding support for municipal programs and investment to develop clean cars, fuels and other technologies to balance investments in highways and transit resulting in less congestion, reduced smog and emissions.

In Ontario, there are over 12 million registered vehicles (including passenger vehicles, motorcycles, mopeds, commercial vehicles, buses, trailers, snow vehicles and off road vehicles), 9.2 million on-road vehicles. 242,00 motorcycles and mopeds, and 33,000 buses; the rest are tractors, trucks and trailers, construction and farm vehicles. Thousands more operate into Ontario from other jurisdictions.
There are over 16,000 kilometres of provincial highway. Placed end to end, Ontario’s highways would span Canada twice.
Since the Ontario Election in 2018, Ontario’s cap and trade program was cancelled. This program funded the Electric Vehicle Incentive program and the electric Vehicle Charging INcentive programs. Currently Ontario has over 4700, Level 2 and 3 charging stations. Ontario currently doesn’t offer incentives for vehicles or chargers, but drivers can access federal grants as available. Over 275,000 EVs are on the road according to 2025 data.
- Level 1 – a 120 volt AC standard wall outlet, capable of adding around 5 to 8 kilometres of range per hour.
- Level 2 – a 240 volt AC outlet, capable of adding around 15 to 35 kilometres of range per hour.
- Level 3 – a 480 volt DC fast-charging station, capable of adding around 100 kilometres of range per hour.
Source: Ministry of Transportation, Ontario
Systems Planning
Well planned cities focus on moving people and goods rather than vehicles. Movement in cities is not an end in itself. We travel to reach people, our jobs, goods and services. In more populated cities, public transport saves valuable space and energy compared to private transport and is given priority on the road. Using public transit saves you money, reduces space needed for parking lots, and helps the city in economically and environmentally. The healthiest and most sustainable modes of transport are, of course, walking and cycling.

Sustainable transportation systems plan for our future by:

- Providing basic access needs for individuals safely and in a manner consistent with human and ecosystem health and planned for future generations
- Being affordable, operating efficiently, offering mode choices, and supporting the economy
- Limiting emissions and waste within the planet’s ability to absorb this pollution, minimizing consumption of non-renewable resources to a sustainable yield level, reusing and recycling the system’s components, and minimizing land use and noise pollution.
TREA members are interested in all aspects of wise travel choices. This includes transit, carpooling, telecommuting, walking and car share to improve peak hour travel, increasing road capacity rather than building more roads. TREA has been a long-time champion for cycling including a Bike Week 1991-2019 and support for CAN-Bike safety programs and other community initiatives.
Did you know?

- All City vehicles use ethanol-blended gasoline or low-sulphur diesel fuel
- The City’s fleet includes 69 Evs and 182 electic vehicles, while the wider city has over 4550 electric and plug-in vehicles registered on its roads (London Hydro)
- Traffic signal lights have been converted to use light-emitting diodes (LEDs), which use 85% less electricity than old-fashioned light bulbs.
Source: City of London
The City’s Long-Term Transportation Corridor Study (2001) was prepared to identify and protect roadway corridors in planning for long-term needs. London’s Transportation Master Plan, started in 2004, was then developed and implemented as policy to identify strategic solutions to roadway needs forecasted over the next 20-25 years, as well as a Transportation Management strategy. The New Mobility Transportation Master Plan has been underway since 2022 and provides London’s first fully integrated mobility plan, including traffic lanes, bus lanes, cycling, sidewalks and pathways by 2050. In 2006, the LTC completed a Growth Strategy which recommended the Bus Rapid Transit system (BRT).
The earlier Master Plan’s target was to improve support for transportation, managing demand on the road, investing in cycling and walking infrastructure, and more strategic programs for road network improvements.
One of the Transportation Master Plan’s targets was to increase transportation mode share in the city from 12.5% to 20% by 2030, and a key objective to achieve that was to implement a BRT network. The proposed network consists of an east-west corridor and a north-south corridor, both to meet in the downtown core. Planning for a rapid transit project began in September 2014, and was branded as “Shift” in January 2015 – see London Transit below. It is expected the two routes will be 24 km or 14 miles long and have approximately 34 stations. For details visit: http://www.londontransit.ca/wp-content/uploads/2018/01/BRT-Handout-FINAL.pdf
Transportation Master Plan Peak Hour Travel Mode Targets
| Mode | 1987 Actual | 2002 Actual | 2013 Actual | 2024 Target | 2030 Target |
| Auto Driver and Passenger | 78.5% | 84% | 73.5% | 77% | 60% |
| Public Transit | 9.5% | 7% | 12.5% | 10% | 20% |
| Cycling/Walking | 12% | 7.5% | 9% | 2% | 15% |
| Other | 2% | 5% | 2% | 5% |
The Master Plan recommended it be updated every 5 years, at the same time as the Official Plan. Reviews should include household travel surveys to update travel characteristics and measure performance of travel mode targets above. To sustain London’s existing transportation system, planning decisions should be made using service-based solutions involving TDM, combined with capacity-based solutions responding to current policies in the Official Plan for a ‘Smart Growth’ approach to land use and density distribution.
In April 2024, Municipal Council approved mode share targets for the Mobility Master Plan, which set a goal to increase the percentage of trips Londoners take using active modes of transportation and transit by 2050. This mode share target calls for an increase in the current walk, cycle, transit portion from 23% to 32.5% or greater and a decrease in the percentage of personal vehicle driving trips from 61% down to 52.5%.
To support the Mobility Plan, a public attitude survey was conducted on preferences and issues, which included the following:
| Transportation System Issues | Importance Response Rate |
| Widening existing roads | 44% |
| Provide new express bus or rapid transit routes | 40% |
| Connect missing parts of city streets | 38% |
| Provide financial incentives to encourage transit | 38% |
| Provide longer hours of transit service | 35% |
| Construct carpool lots, high occupancy vehicle lanes | 35% |
| Build new major roads through/around the City of London | 35% |
| Increase frequency of transit service | 35% |
| Provide financial incentives to encourage carpooling | 34% |
| Add more transit routes | 31% |
| Build new bike trains or dedicated bike lanes on city roads | 23% |
Transit has been demonstrated to be a preferred area to build on towards sustainable transportation in developing London’s future transportation system.
Two alternative strategies recommended toward forecasted needs for 2024 were:
- Capacity enhancement – where travel characteristics and mode shares are maintained at current levels over 20 years and needs are addressed through increased roadway network capacity, i.e. road widenings, extensions and new roads where required; and
- Transportation Demand Management (TDM) opportunities involving measures and programs designed to reduce the number of trips made by single occupancy vehicles (SOV) during peak travel periods through demand reduction and demand shifting

In Canada, 23% of the nation’s estimated GHG emissions are due to transportation; this is an increase of 19% from 1990 levels. Despite the advent of hybrid and electric vehicles, Canadians are increasingly driving larger and less fuel-efficient vehicles according to London’s Master Plan. Traffic congestion costs Canadians $2.8 billion – $4.4 billion per year, of which 90% is attributable to time lost in traffic. The remainder of this cost is borne by increased fuel consumption and increased GHG emissions. TDM strategies have the best potential to reduce this level mainly through reduced trip-making. Conversely, increased capacity enhancement is expected to increase emissions to the largest degree. Fuel consumption during AM peak hour travel is expected to increase from 57,850 litres in 2002, to between 79,990 and 81,210 litres in 2024.

One busload of passengers takes 40 vehicles off the road during rush hour, saves 70,000 litres of fuel and avoids more than 175 tonnes of GHG emissions a year. Carpooling with one other person immediately halves the emissions for that trip. On average, a carpool saves 2,000 litres of gasoline a year.
Source: Pollution Probe, Climate Change and Human Health, 2004.

Transportation Demand Management results are meant to encourage actions that lead to a more efficient use of the existing transportation system through three strategies – mode shifts away from single occupancy vehicles, peak hour trip reduction and overall reduced trip-making. TDM measures include: investment in expanded facilities for non-motorized transportation (ie. cycling infrastructure improvements such as worksite bike racks, bike shower/locker facilities), workplace programs encouraging flex hours, telecommuting, ride-share and health and economic benefits of walking and biking, school programs to encourage walking and biking. Transportation Demand Management supportive land use policies (ie. corridor protection, density intensification and mixed land use), management of vehicle parking supply and cost, increased public transit ridership (ie. discounted transit passes) and removal of barriers that keep individuals from using alternative modes of transportation (ie. guaranteed commuter ride home programs, bike racks on buses, marked bike lanes, cycling skills training, shifting peak travel hours) and incentives (ie. carpooling preferential parking).
National Transit Demand Management best practices include disincentives (tolls, parking levies or congestion pricing) and high occupancy vehicle (HOV) lanes. Tolls or lanes are not usually put into practice in mid-sized cities nor does London experience prolonged congested traffic conditions at this time.


Cycling and Walking
Active transportation (walking and cycling) is not only better for the environment because it does not create GHG emissions, but it’s also better for us to be active throughout the day.

London’s Bicycle Master Plan (2016) has been officially superseded by the city’s newer mobility plan and Climate Emergency Action Plan, though its foundational goals continue to shape ongoing road and path projects. The further development of a long-term, comprehensive, on- and off-road cycling commuter network and recreational bicycling network has been officially superseded.
The City has published a combination of printed maps for recreation and commuting for the public since 1992. The 2026 bike and walk map is available at City Hall and the city’s website and offers additional information including cycling tips, rules of the road, information on the city’s bike boxes, bike fix-it stations, bike lanes, bike racks, and a link to the Ministry of Transportation’s in-depth Cycling Skills manual. Access the updated bike and walk map here.

Remember – ride a bicycle that fits you. Be visible. Wear a helmet. Ride defensively. Lock your bicycle. Keep your bicycle in safe operating condition. Maintain a low center of gravity. Use a bell, lights at the front and back of your bike (if you ride between ½ hour before sunset and ½ hour after sunrise), and reflective tape.

Bicycle stores and repairs in London
| Atmosphere Canada Bicycle Shop | 3165 Wonderland Rd S 519-668-1776 |
| The Cyclepath Bicycle store | Sherwood Forest Mall, 1225 Wonderland Rd N Unit 17A 519-432-2208 |
| Cycles London Inc Bicycle store, offers bike tune-ups | 4026 Meadowbrook Dr 519-936-1180 |
| Cyzzle Cycles Bicycle store | 2524 Main St 519-203-2300 |
| E-Ride London Electric Bikes and Scooters | 92 Wellington St 519-601-7433 |
| First Cycleworks Bicycle store. Offers wide selection, including used bikes. Visit website for services. | 535 First St 519-455-9124 |
| Gremlins Bicycle Emporium Bicycle store selling new and used, and tune-ups | 623 Richmond St 226-884-4869 |
| Happy Bike Repairs London Bicycle Repair Shop | 345 Talbot St 226-667-2453 |
| London Bicycle Café Bicycle service centre | 24 York St. 226-289-2670 |
| London Eco Bikes Electrical Bicycles | 555 York St. (Main Level Unit 101) 519-601-7887 |
| MEC London | 1051 Wellington Rd 519-668-6657 |
| Moto Kave E-Bikes and E-Scooters | 6402 Hamlyn St 519-471-3618 |
| Outspokin Cycles Bicycle store and services | 867 Hamilton Rd 519-933-2953 |
| Spoke & Sprocket Bicycle repair services | 1890 Hyde Park Rd 519-694-7300 |
| Sport Chek Bicycles and bicycle gear | Various locations |
| Squeaky Wheel Bike Co-op A volunteer supported, self-serve bike repair shop | 740 Dundas St Unit 4 226-503-0043 |
| To Wheels Bicycle store and repair services | 134 Dundas St 519-434-4301 |
| Trek Bicycle Store of London Bicycle Store | 4487 Wellington Rd S 519-680-5100 |
| Wheels & Gears Bicycle sales and service | 528 Adelaide St N 519-601-0528 |
| Vélofix Mobile Bike Shop that services the London community. | Book your service here |
Bicycle Courses and Groups in London Promoting Bicycle Riding:
| CAN-Bike London | CAN-Bike London offers nationally accredited CAN-Bike cycling courses for all ages on how to ride more safely to gain more confidence and control on city streets around the city. How to register: Email info@canbikelondon.ca for further details and information about upcoming dates |
| Attack Racing | A youth development cycling team. Prices vary depending on the registration options you prefer. How to register: Email: admin@attackracing.ca Website: ccnbikes.com |
| Forest City Velodrome | The Forest City Velodrome is a 138m indoor cycling track. The Forest City Velodrome Association is a not-for-profit organization and operates the races, clinics and other activities at this track. How to register: You can join to become a member and obtain membership packages for access to the tracks and services. Visit their website here. |
| Gremlins Bicycle Emporium | Gremlins do group rides weekly. They occur Thursday evening for the group rides and they begin May 1st and run until October. Details and updates are shared on their social media. They have bicycle paths that they go on and also have available on the website. For more information or to register: the website can be accessed here. |
| Huff N’ Puff Senior | This senior fitness association is for people ages 55 and over and participates in weekly morning rides. You can register for a membership. Where to register and get more information: Website |
| London Centennial Wheelers | The club’s focus is in touring and road racing. Many members are also involved in mountain bike racing, cyclocross and triathlons. Recreational cyclists who like to push themselves to go a little faster are also welcome. Where to register and get more information: https://www.lcw.ca/join-us |
| London Cycling Club | This is a non-profit cycling club for everyone in the London area. Rides include going to local towns and exploring London area on group bicycle rides. For more information: https://www.londoncyclingclub.com |
| London Cycle Link | The Ride to Thrive program focuses on teaching grade 5 and 6 students—in a fair, equitable and accepting environment—that cycling is for everyone. |
Bicycle Map of London, ON 2026
The London Bike and Walk Map highlights trails and bike lines in London. Download the image here.
London Transit Commission (LTC)
London Municipal Council continues to oversee the LTC through all-counsellor board as goverenance reviews operational updates progress. LTC’s business plan can be found here.
LTC’s 2027 operating budget is set as follows:
| Category | Conventional | Specialized | Total |
| Revenue | $55,106,500 | $984,500 | $56,091,000 |
| Expenditures | $114,808,400 | $19,615,900 | $134,424,300 |
| City of London | $59,701,900 | $18,631,400 | $78,333,300 |
London Transit Commission (LTC) is a valued community service and a key component of a sustainable transportation system. They serve over 23 million passengers every year. LTC is able to cover 44% – 52% of their annual operating costs through passenger fares. LTC has been fortunate that federal and provincial funding programs have become more accessible in recent years in supporting public transit services, including gas tax funds and one-time grants for allocation to new buses and system enhancement measures. Recently, LTC has expanded, and you can now purchase passes called “Smart Cards” alongside your regular tickets. To figure out how to plan your trip with the exact routes and times, you can go to their website.
http://www.londontransit.ca/staff-report-3-re-london-transit-five-year-ridership-growth-strategy/

The Mobility Master Plan is the city’s long-term transportation strategy. One of its goals is to increase transit use to 13% of all trips as a mode of transport, and to 20% by 2030, based on a 2009 survey on the city’s travel patterns and choice of transportation. Meeting this target means building on service, operating efficiency, continued effective fare pricing, land use planning, public education and long-term sustainable funding to increase ridership. There is a need for a more efficient system, with the current transit network already close to reaching maximum capacity, for example, with late buses, missed passengers and overcrowding.
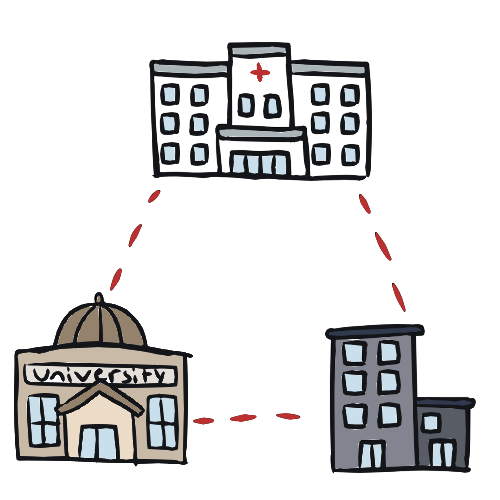
London’s plan for a Bus Rapid Transit System (BRT) has been created to address the city’s growth and sustainability commitments. The BRT is set to link downtown, post-secondaries and other major centres of the city. Rapid Transit includes bus-only lanes, traffic signals for buses, improved connections with existing bus routes, accessible stations with real-time bus information, and more frequent service. The full BRT is expected to roll out in stages, beginning with the East London Link in 2027 and Wellington Gateway in 2029. Rapid transit corridors in the North and West of the city are also planned. The plan will also allow for many routes to have more frequent service, while other areas with limited service will be extended. https://london.ca/living-london/roads-sidewalks-transportation/cycling-active-green-transportation/transit/rapid
The Downtown Loop was the first of London’s rapid transit projects and included bus-only lanes and enhanced rapid transit stops. Phase one of the project was built in 2021 to add a bus-only lane, and construction of Phase two began in 2022, carrying over to 2023. Phase three construction began in April 2023, and the Downtown Loop was completed in 2024. https://london.ca/projects/downtown-loop
Parking
Parking is potentially the most significant driver of choice for transit use, as many aspects of parking management significantly influence commuters’ decision-making process when determining their mode of transportation. Disincentives to single-occupant vehicle use, particularly during peak periods, require TDM strategies such as preferential pricing, park and ride strategies and ‘no net gain’ parking policies for downtown areas.

Electric Scooters
Electric scooters are now supported in London, and are legal for use for those aged 16 and older. Users who are 16 or 17 must wear a helmet. This is aimed at supporting London’s Climate Emergency Action Plan and reducing the city’s carbon footprint. They can be ridden on roadways posted at 50 km/h or less, in bike lanes, and on any multi-use pathways, including the TVP. However, usage on sidewalks, hiking trails and ESAs is not permitted. The speed limit for electric scooters is 24km/h. For parking, the city has made it accessible by allowing users to park them at any bike rack just as you would for a bicycle, except riders are not allowed to carry passengers or cargo.. There are many stores around London where you are able to purchase an e-scooter, such as E-ride, Moto Kave, and London Eco Bikes.
Transportation Efficiency
Driving a car: tips for better fuel economy
Tires

- Keep tires properly inflated, check tire pressure monthly-resistance in you tires contributes 20% of fuel consumption
- Be sure to rotate your tires regularly and ensure a fuel efficient highway tread when appropriate rather than all seasons (important for SUVs)
Save your fuel
- Avoid idling as a vehicle warms up faster being driven, than at idle – idling for 10 seconds or more uses more fuel that restarting the vehicle

- Watch your speed, avoid peak hour traffic, plan your trips
- More gas is consumed in lower gear, so go through the lower gears gently and quickly
- Reduce aerodynamic drag by removing roof racks, snow & ice
- Use flow-through ventilation versus open windows or air conditioners
- Remove unnecessary heavy objects from the trunk as they waste fuel
- Avoid rapid acceleration and hard braking, drive moderately
- Use cruise control when appropriate

- Use carpooling as a way to cut costs and share driving responsibilities
- Budget in the winter for more travelling time and fuel usage
Tune-ups

- Good car repair can improve fuel usage up to 50%
- Premium oils reduce friction: fuel use can be reduced by 6%
- Ensure battery cables aren’t corroded
- Regularly change the air-filtre, as recommended in the car’s manual
Road surfaces

- Drive in ruts in winter so you are not pushing snow away
- Wet snow on your car adds extra weight so remove it
- Gravel and rough road surfaces are worse for fuel efficiency than smooth roads
Fuel-saving options
Use carpooling as a way to cut costs and share driving responsibilities, ask your employer for preferred parking rates.
- Use the right grade of gasoline from your vehicle owner’s manual
- Shop aggressively for the best price for fuel locally (use apps like gasbuddy for this!)
- Limit purchases when prices are high
- Don’t “top off” at the pump as it releases gas fumes into the air, which cancels the benefits of the pump’s anti-pollution devices and make sure your fuel fill cap is on tight and working right
- Spilled gasoline evaporates to aggravate smog and can leak into groundwater
- Refuel during cooler periods of the day or in the evening to prevent gas fumes from heating up and creating ozone
- Park in the shade in summer to keep your car cool and minimize evaporation of fuel
- If you have a garage, use it as much as possible to keep your car warm in winter and cool in summer
- Use the computer and telephone/fax to replace vehicle trips for business, shopping and services when possible, telecommute or arrange a teleconference, or video call to reduce travel
- Cruise control can help most drivers save fuel on the open road by keeping speed constant and preventing inadvertent speeding
- Know before you go – get travel and transit updates before you leave home so you won’t get stuck in a traffic jam here or on the highway
- Take the bus, the train, ride your bike or walk one day a week to work, school, the corner store, the gym or for recreation
- If there is frequent travel between larger offices in two areas of the city, ask your employer to create a shuttle service to transport people or goods
Options which increase fuel consumption

V8 engine for hauling loads, turbocharging, automatic transmission without torque-converter lock-up, four-wheel drive, sunroof, roof rack, power steering and air-conditioning. Increasing your highway cruising speed from 100 km/hour to 120 km/hour will increase fuel consumption by 20% – Canadian Automobile Association
Converting your car to run on alternative fuels
Many car engines can now be converted to use less polluting and less expensive fuels. The conversion may add a second fuel tank and has no effect on your gas tank so that you still have your choice of fuels for your car.
Alternative fuels include natural gas, propane, methanol, biodiesel, electricity, ethanol and hydrogen. Natural gas, propane, and methanol are called “near-term” technologies as they have more widespread acceptance.
They emit much less carbon monoxide, nitrogen oxide and carbon dioxide than that of gasoline or diesel fuel, therefore, reducing urban smog and greenhouse gases. This is a very important benefit as over 40% of air pollution locally is caused by vehicles. During refuelling, natural gas and propane fuels give off little or no pollution because of sealed systems containing these fuels. As methanol is a liquid, it creates evaporative emissions but at lower levels than gasoline.
Natural gas is a cleaner-burning fuel, found in abundance in Canada as a mixture of gases in porous rock formations. It produces less sulfur dioxide, nitrogen oxides and particulate matter than petroleum. However, it is composed mostly of methane and is mined from underground deposits, making it a non-renewable source. It is initially extracted from the ground, processed to remove impurities and compressed to be stored and transported by pipeline. Canada is the fourth largest producer and exporter of natural gas in the world according to NRCan Annual production in 2016, there was 77 trillion cubic metres of proved reserves in Canada alone, mostly from Alberta and British Columbia.Major high-pressure pipelines carry natural gas from its source to pipelines of natural-gas utility companies, which in turn take it to your home for heating or to a retail gasoline station to be compressed, stored and used to fuel vehicles.

Propane is a cleaner-burning gaseous fuel that produces fewer emissions and pollutants than gasoline, diesel or fuel oil. However, it is a non-renewable source. It is pressurized and stored as a liquid when used in vehicles. It is often called LPG (liquefied petroleum gas) or auto propane. Most of Canada’s propane is a derivative of natural gas production. About 85 percent of Canada’s propane is produced at natural gas plants in Western Canada, whereas the rest is a byproduct of oil refining. Propane is distributed by pipeline, railcar and bulk trucks and trailers. Like gasoline, propane is sold in litres.

Biodiesel is to diesel what ethanol is to gasoline. It is a non-toxic and biodegradable fuel made from renewable sources (soybeans, canola and tallow), vegetable oils, waste cooking oil, animal fats or tall oil (a byproduct of pulp and paper processing). By reacting the fasts with an alcohol (usually methanol but ethanol can be used) and a catalyst (such as sodium hydroxide),to produce glycerine and an ester called biodiesel. Biodiesel blends, a mixture of petroleum diesel and biodiesel, can be used in any diesel engine. In blends higher than 5% biodiesel, discuss switching to this fuel with a mechanic or your car producer.Biodiesels may not be the best for Canada,in colder climates biodiesel tends to gel and freeze, particularly at higher blend levels. Research and testing is underway to reduce biodiesel production costs and address cold weather problems. Currently, biodiesel is not commercially available as a pre-blended mixture with regular petroleum diesel rather than as pure fuel at standard fuel pumps.
London’s Anaerobic Digester and Biogas Plant (largest organic waste plant in Canada). For more information, visit https://www.facebook.com/photo.php?fbid=1512155267614158&set=a.616913330471694&type=3&ref=embed_post.
Ethanol or “Gasohol” is produced from fermentation of sugar or converted starch contained in grains and other agricultural or agri-forest feedstocks. In Canada, ethanol is presently made principally from corn and wheat. Research into technology to produce ethanol from non-food sources is advancing rapidly and is close to commercialization. When mixed with gasoline in low-level blends, it performs well in combustion engines and emits fewer emissions. Some vehicles are specially manufactured to operate on an ethanol blend that contains between 51% and 83% ethanol and at least 15% gasoline. This “ethanol flex fuel” is presently used by some organizations with large vehicle fleets, but it is not yet commercially available in Canada. Vehicles branded “flex fuel” and some newer vehicles can utilize this fuel. Here in London, it is standard to have up to 10% ethanol. Ontario is the leader in Canada in both ethanol production and consumption and requires that gasoline sold in the province has at least a minimum of 11% ethanol in regular grade gasoline (as of 2025). 13% is mandated for 2028 and a maximum of 15% by 2030.

Battery-electric vehicles are powered by motors that draw electricity from on-board storage batteries. In recent years, green vehicles have become much more popular. This could be due to the previous incentive programs the government put in place to help offset the price of a new vehicle. One of the biggest downfalls of electric vehicles in the past was the range. As of 2017, batteries have improved range; the average battery-electric vehicle now has a range from 400 to 450 kilometres between charges under ideal conditions. Green vehicles often come with an 8 to 10-year battery warranty and are designed to last the lifetime of the car. A commercial-use battery-electric vehicle may need to replace the battery every 2-3 years.
Electric Vehicle (EV)
Targets for EV in Canada:
To help decarbonize the transportation sector and promote the shift to EVs, Canada set a national target of 100% zero-emission new vehicle sales by 2035 with interim targets of at least 60% by 2030. However, the target was replaced in 2026 with tighter emission standards, targeting a revised percentage of 75% EV sales by 2035 and 90% by 2040.
This policy is a cornerstone of Canada’s broader 2030 Emissions Reduction Plan, which seeks at least a 45% cut in greenhouse gas emissions below 2005 levels by 2030.
The new standard complements ongoing federal measures to support ZEV adoption, including purchase incentives (up to $5,000 per vehicle) and substantial investments in charging infrastructure. The policy also ensures Canada remains competitive with jurisdictions like California, the EU, and other G7 nations enforcing similar ZEV mandates. As part of a coordinated strategy with provincial programs and industry engagement, this regulatory approach is expected to significantly increase ZEV availability, reduce emissions, and improve consumer choice in Canada.
Recent trends show strong growth in vehicle registrations and zero-emission motor vehicle (ZEV) uptake. In 2024, Ontario led the country with 699,289 new vehicle registrations, an 8% increase from 2023. ZEVs made up 14.6% of new vehicle registrations across Canada, and Ontario accounted for 20.9% of that total, despite representing just 8.1% of national vehicle registrations. As of mid 2026, over 275,202 EVs (including battery-electric and plug-in hybrids) were registered in Ontario—indicating strong adoption momentum.
Ontario continues to expand its EV infrastructure and green fuel policies. While southern Ontario is relatively well served with charging networks, northern regions remain under-served, with fast chargers limited outside Tesla networks. To support cleaner fuel use, the province’s Cleaner Transportation Fuels Regulation requires fuel suppliers to blend 10% renewable gasoline (rising to 15% by 2030) and 4% renewable diesel. Ontario has also become a national EV manufacturing hub, attracting more than $28 billion in electric vehicle and battery-sector investments, aimed at building a more sustainable and competitive transportation economy.
Charging Tips -According to the MTO:
- If you only have one hour you can charge for one hour and go – you don’t need to charge to 100% all at once.
- On average a typical battery EV will cost less than $300 per year, or about $0.78 per day to charge at night. *1
- A typical plug-in hybrid EV will cost about $700 per year, or $1.92 per day for fuel (including gasoline and electricity costs). *2
- Comparable gasoline cars can cost between $1,000 and $2,500 per year to fuel – up to eight times more money spent each day. *3
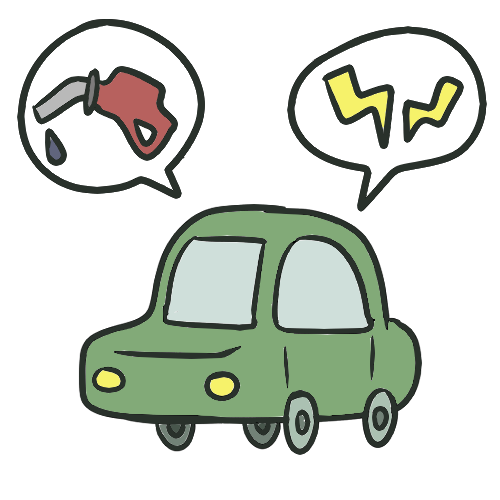
Hybrid electric vehicles combine a battery powered electric motor with a conventional internal combustion engine, diesel or gasoline. Thus they offer the extended driving range and rapid refuelling of conventional vehicles, together with many of the energy and environmental benefits of electric vehicles. These vehicles have a driving range from 20-80 km on a full charge. Once the battery is empty, the gasoline or diesel engine engages for an additional +500 km of range. Since most daily driving is done short distances and within a city, the electric motor is often sufficient providing great fuel saving benefits. A number of hybrid vehicle models are widely available on the market today, with many more manufacturers planning on introducing new hybrid electric/gasoline vehicles in the next few years.
Fuel cells generate electricity by electrochemically combining hydrogen and oxygen. Converting hydrogen gas with oxygen will produce electricity, water and heat. The driving range of a vehicle operated by fuel cells is comparable to that of a traditional gasoline engine. Refuelling is also comparable, as pressurized hydrogen is sold at hydrogen refueling stations. These cars shut down the fuel cell when stopping in traffic or at lights. In some models, a mode called regenerative braking is used to harness lost energy and recharge the battery. Fuel cell vehicles reduce greenhouse gas emissions by about 30%, as compared to its gasoline engine counterparts.
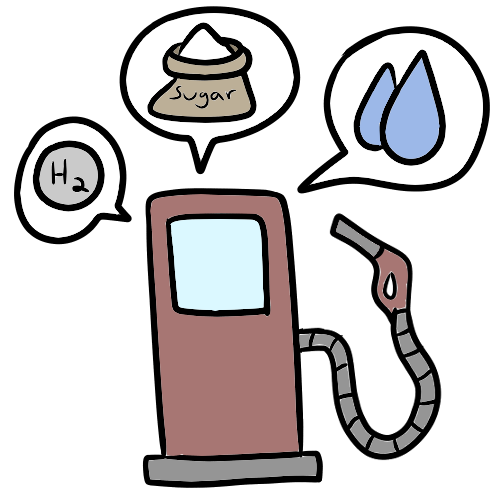
Due to the variety of fuels including renewables available for conversion to hydrogen, fuel cells are a viable energy technology, one that may offer significant environmental, energy efficiency, supply and economic benefits. But there are still many barriers to their use in vehicles, including the lack of a hydrogen distribution infrastructure, high capital costs for fuel cells and hydrogen-production technologies, and challenges related to hydrogen storage. Hydrogen can be extracted from thousands of compounds, including natural gas, water, sugar and many petroleum products. The extraction of hydrogen requires energy which makes hydrogen an energy carrier rather than an energy source.
Hydrogen emissions could be derived from:
- Electrolysis of water to form hydrogen and oxygen. Clean sources of electricity (wind, solar, geothermal and possibly nuclear) would be preferred – Reforming of a hydrogen
- Gasification of coal
- Steam methane reforming, extracts hydrogen from methane, however this releases GHG emissions
- Rich feedstock such as ethanol, methanol, natural gas or even gasoline. Biomass could be used for ethanol production. CO2 emissions are a byproduct of reforming natural gas and gasoline
Sources: Natural Resources Canada, Ministry of Energy – Ontario
What can you do in London?
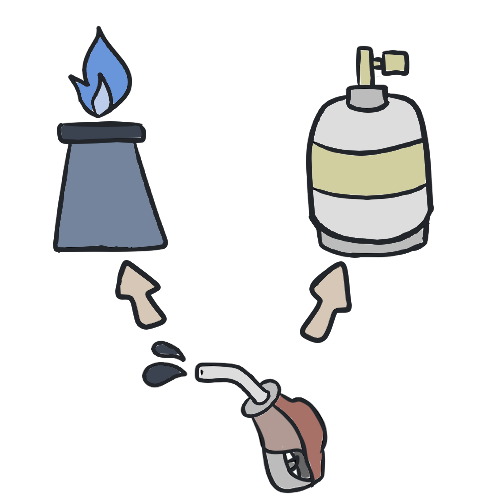
You can convert your car to run on a dual fuel system using gasoline/propane or gasoline/natural gas.
E.g. Propane-powered vehicles create less emissions than gasoline-powered. They emit 12% less carbon dioxide, about 20% less nitrogen oxide, up to 25% less greenhouse gases, and up to 60% less carbon monoxide. With a propane vehicle, the engine performs about the same as gasoline powered.
Propane is readily available at several London locations. Also, natural gas refueling stations are in most major centres between Windsor and Toronto.
Currently, buyers of eligible green vehicles can receive a rebate of up to $5000 through the Electric Vehicle Affordability Program.
In the past, London and Ontario offered refunds and incentives to offset the cost of buying a green vehicle.
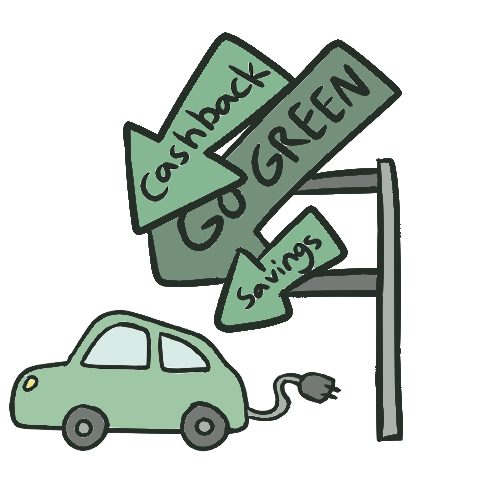
Refunds used to include:
- $750 for propane vehicles
- $1,000 for vehicles powered by any other alternative fuel
- $2,000 for HEVs delivered to purchasers after March 23, 2006 and before April 1, 2012
The above dollar limits do not include the tax for fuel conversion (TFFC) that may be charged on the purchase of new vehicles powered by alternative fuels. A refund can be requested for the TFFC paid if the vehicle operates or is converted to operate exclusively on an alternative fuel. Further, hybrid vehicles operating on both gas and electricity would also qualify for the refund.
A vehicle converted after purchase may also qualify for a refund of retail sales tax. To qualify, the vehicle must be converted within 180 days from when it was purchased. The purchaser may still be entitled to a refund of retail sales tax on the cost of the conversion kit and labour to install the kit if the conversion is not completed within the 180 days. Refund applications must be received within 4 years from the date the tax was paid. A refund is not available on vehicles using a mixture of an alternative fuel and gasoline or diesel fuel. The retail sales tax paid when an extended service contract or warranty is purchased is also not refundable.
Companies like UPS, Canada Post and FedEx use propane-fuelled vehicles for increased efficiency and reduced emissions. UPS, for instance, has more than 35,000 low-emission vehicles and fuel-efficient aircraft, and aims to have 106,000 new vehicles by 2028, including 45,000 battery electric vehicles.
A decision by London Police Services to convert much of its fleet to run on propane has saved taxpayers millions of dollars in fuel costs. In 1982, the London Police Services tested propane as an alternative fuel in two of the service’s fleet vehicles. The results were so encouraging that as of 2012 all of their frontline patrol vehicles run on propane (that’s 89 vehicles) at 55% the cost of gasoline. The police also have replaced many of their vehicles with smaller, more fuel efficient vehicles, reducing their consumption to 12,000 L a year. Newer vehicle models have not been converted to propane because there isn’t a conversion kit that will reliably convert vehicle. In total 2015, fleet propane consumption saved $429,830.
In 2015, LPS bought an electric vehicle for the courier service, and replaced another gas-powered cart for fleet and facilities with an electric cart. It is currently implementing a phased – in EV strategy to replace 14 traditional fuel-powered vehicles by the end of 2027.

Cars and trucks are the largest source of air pollution within our borders. Making smart choices on how, where and when we drive will have a huge impact on cleaning up our air. For more details on transportation impacts, also visit our Air Quality Chapter.
A poorly maintained vehicle can produce 50% more CO2 and uses up 50% more fuel than one that runs properly.
Options for reducing vehicle use
A key aspect of reducing your vehicle use is a corresponding increase in using alternatives including public transit, ride sharing, cycling and walking.
As single-occupancy vehicles represent a major source of ozone pollution:


- Walk or bicycle more frequently to and from work, school, the corner store or for recreation and create virtually zero pollution
- Take public transit or the train when possible – this saves energy and is less stressful than driving distances on your own
- Rideshare and lobby your employer for reduced parking rates
- If there is frequent travel between offices, create a shuttle service to transport people or goods between buildings
- With a modem, telephone and/or fax machine, reduce the environmental costs of commuting each day by working out of your home
- Combine your trips and plan ahead
The following organizations are looking to solutions on transportation issues:
| Name | Contact |
| The Association for Commuter Transportation of Canada (ACT Canada) | 2031 Merivale Rd Nepean, ON 613-226-9845 Info@ACTCanada.com |
| Transport Canada | Contact page |
| Federation of Canadian Municipalities | 24 Clarence Street Ottawa, ON 613-241-5221 |
| Canadian Urban Transit Association | 55 York St Toronto, ON 416-365-9800 |
| Green Communities Canada | 1545 Monaghan Road Peterborough, ON 705-745-7479 |
| Pollution Probe | 902-130 Queens Quay East Toronto, ON pprobe@pollutionprobe.org 416-926-1907 |
| Victoria Transit Policy Institute | Online resources |
| U.S. Environmental Protection Agency | Resources on the topic of transportation, air pollution, and climate change |
| Ontario Ministry of Transportation | 777 Bay Street, 5th floor Toronto, Ontario M7A 1Z8 Tel: 416-235-4686 Toll-free: 1-800-268-4686 |
References
Statista – Transportation fuel demand and biofuel share in Canada
https://www.statista.com/statistics/1550401/transportation-fuel-demand-and-biofuel-share-canada
Transport Canada – Addendum Tables 2023 (Table EN3)
https://tdih-cdit.tc.canada.ca/en/addendum-tables-2023/EN3
Statistics Canada – Refined Petroleum Products: Year in Review 2024
https://www.statcan.gc.ca/o1/en/plus/8203-record-high-production-and-exports-refined-petroleum-products-year-review-2024
Canada Energy Regulator – Canada’s Energy Future 2023
https://www.rec-cer.gc.ca/en/data-analysis/canada-energy-future/2023/results
Transport Canada – Transportation in Canada 2023 & 2024 Reports
- 2023 ZEV Statistics
- 2024 Modal Overviews
Government of Ontario – Powering Ontario’s Growth
https://www.ontario.ca/page/powering-ontarios-growth
Natural Resources Canada – Ontario Transportation Energy Use Tables
(Comprehensive Energy Use Database)
- Passenger Energy Use
- Freight Energy Use
- GHG Intensity
Government of Ontario – Cleaner Transportation Fuels Regulation
https://www.ontario.ca/page/cleaner-transportation-fuels
Statistics Canada – New motor vehicle registrations, 2024
https://www150.statcan.gc.ca/n1/daily-quotidien/250313/dq250313c-eng.htm
Government of Ontario – Cleaner Transportation Fuels Regulation
https://www.ontario.ca/page/cleaner-transportation-fuels
Ontario Budget 2024 – Chapter 1: Building Ontario
https://budget.ontario.ca/2024/chapter-1a.html
Electric Vehicles
https://www.canada.ca/en/environment-climate-change/news/2023/12/canadas-electric-vehicle-availability-standard-regulated-targets-for-zero-emission-vehicles.html
London Transit
https://www.londontransit.ca/our-services/conventional-transit/